Pandas Standard Deviation
In this Pandas with Python tutorial, we cover standard deviation. With Pandas, there is a built in function, so this will be a short one. The only major thing to note is that we're going to be plotting on multiple plots on 1 figure:
import pandas as pd
from pandas import DataFrame
from matplotlib import pyplot as plt
df = pd.read_csv('sp500_ohlc.csv', index_col = 'Date', parse_dates=True)
print(df.head())
Typical stuff you've seen above.
Next, we make our standard deviation column:
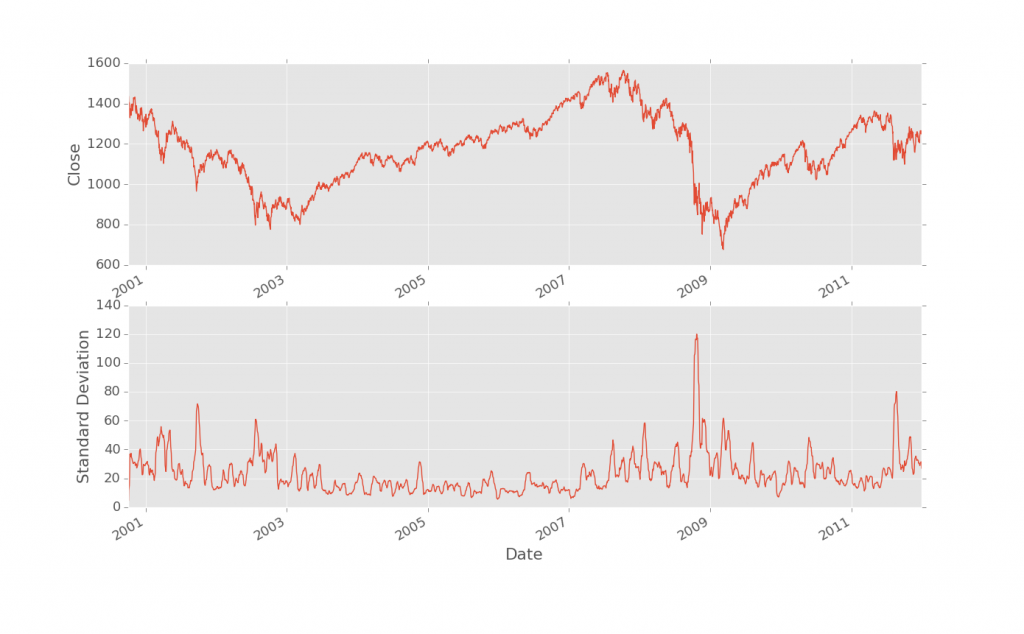
df['STD'] = pd.rolling_std(df['Close'], 25, min_periods=1)
Hey, that was easy! Now let's plot it all. Let's compare price to standard deviation.
ax1 = plt.subplot(2, 1, 1)
df['Close'].plot()
This is new! It's not too hard though. When you add subplots, you have three parameters. The first is how many "Tall" you want (height), the second parameter is how many wide (width) you want. The 3rd parameter is the # of the plot. So, if you have a 2 x 1, that means you have only 1 column of subplots, but two rows. #1 would be the top, #2 would be the bottom. If you had a 2x2, then #1 would be top left, #4 would be bottom right, #2 would be top right, and #3 would be bottom left.
ax2 = plt.subplot(2, 1, 2, sharex = ax1)
df['STD'].plot()

plt.show()
But wait, there's more! It looks like we had a 4th parameter... they just keep on coming! The fourth parameter we're using here is a parameter telling matplotlib that we'd like to always have the x-axis line up on both charts. This makes moving the charts around, zooming, and general chart manipulation keep things in line. It's a nice touch for sure.
That's all there is to it. Really, learning how to plot multiple figures and do shared axis was more than standard deviation!
-
Intro to Pandas and Saving to a CSV and reading from a CSV
-
Pandas Column manipulation
-
Pandas Column Operations (basic math operations and moving averages)
-
Pandas 2D Visualization of Pandas data with Matplotlib, including plotting dates
-
Pandas 3D Visualization of Pandas data with Matplotlib
-
Pandas Standard Deviation
-
Pandas Correlation matrix and Statistics Information on Data
-
Pandas Function mapping for advanced Pandas users
