Graphing example from SQLite
In this tutorial, we're going to show how you can use a select query, and iterate through it, to get data that you can make use of. In this example, we're going to generate a Matplotlib graph. Check out that tutorial regarding how to get Matplotlib if you do not already have it.
Code up to this point:
import sqlite3
import time
import datetime
import random

conn = sqlite3.connect('tutorial.db')
c = conn.cursor()

def create_table():
    c.execute("CREATE TABLE IF NOT EXISTS stuffToPlot(unix REAL, datestamp TEXT, keyword TEXT, value REAL)")


def data_entry():
    c.execute("INSERT INTO stuffToPlot VALUES(1452549219,'2016-01-11 13:53:39','Python',6)")

    conn.commit()
    c.close()
    conn.close()

def dynamic_data_entry():

    unix = int(time.time())
    date = str(datetime.datetime.fromtimestamp(unix).strftime('%Y-%m-%d %H:%M:%S'))
    keyword = 'Python'
    value = random.randrange(0,10)

    c.execute("INSERT INTO stuffToPlot (unix, datestamp, keyword, value) VALUES (?, ?, ?, ?)",
          (unix, date, keyword, value))

    conn.commit()
    time.sleep(1)

def read_from_db():
    c.execute('SELECT * FROM stuffToPlot')
    data = c.fetchall()
    print(data)
    for row in data:
        print(row)

    c.execute('SELECT * FROM stuffToPlot WHERE value = 3')
    data = c.fetchall()
    print(data)
    for row in data:
        print(row)

    c.execute('SELECT * FROM stuffToPlot WHERE unix > 1452554972')
    data = c.fetchall()
    print(data)
    for row in data:
        print(row)

    c.execute('SELECT value, datestamp FROM stuffToPlot WHERE unix > 1452554972')
    data = c.fetchall()
    print(data)
    for row in data:
        print(row[0])

read_from_db()
c.close
conn.close()
Now we will make another function, called graph_data:
def graph_data():
    c.execute('SELECT datestamp, value FROM stuffToPlot')
    data = c.fetchall()

    dates = []
    values = []

    for row in data:
        dates.append(parser.parse(row[0]))
        values.append(row[1])

    plt.plot_date(dates,values,'-')
    plt.show()
In this example, we're grabbing the datestamp, and the value from the table. From there, we're iterating through the return to popluate a dates and values list. After that, we use Matplotlib to plot the data. This means we probably need to import Matplotlib! Add the following to the top:
import matplotlib.pyplot as plt
import matplotlib.dates as mdates
from dateutil import parser
from matplotlib import style
style.use('fivethirtyeight')
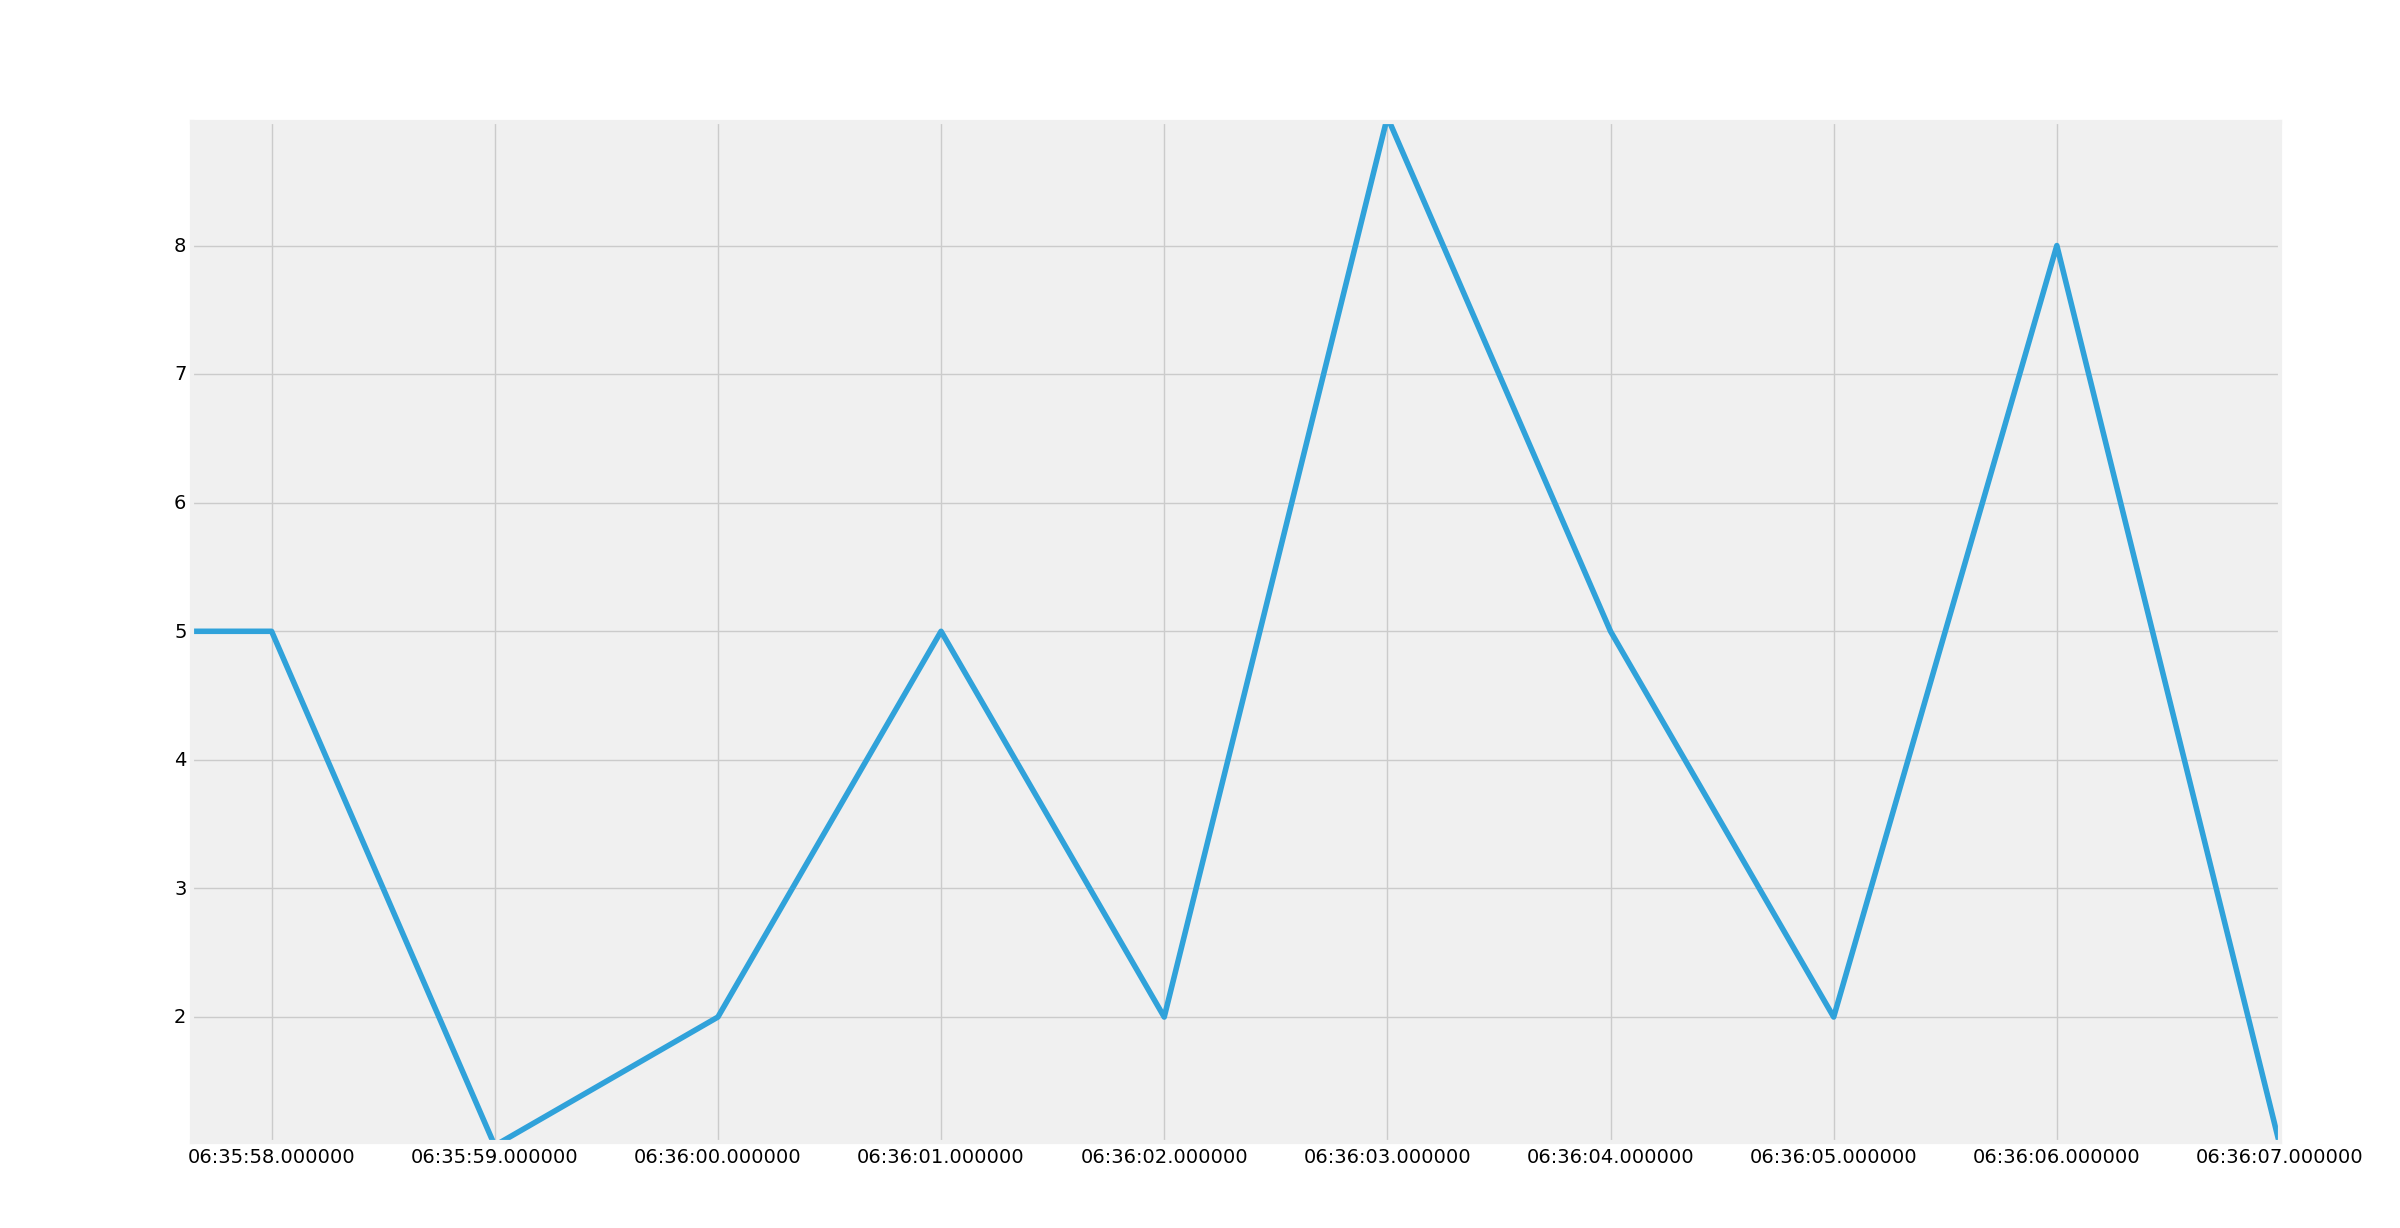
Run that, and you should get a graph like:
Your graph will be a different line, since our numbers were randomly generated.
Next, we're going to cover how to modify existing data and how to delete from the database table.
There exists 2 quiz/question(s) for this tutorial. for access to these, video downloads, and no ads.
