Data Analysis with Python and Pandas Tutorial Introduction
- Install numpy, matplotlib, pandas, pandas-datareader, quandl, and sklearn
Need help installing packages with pip? see the pip install tutorial
What is going on everyone, welcome to a Data Analysis with Python and Pandas tutorial series. Pandas is a Python module, and Python is the programming language that we're going to use. The Pandas module is a high performance, highly efficient, and high level data analysis library.
At its core, it is very much like operating a headless version of a spreadsheet, like Excel. Most of the datasets you work with will be what are called dataframes. You may be familiar with this term already, it is used across other languages, but, if not, a dataframe is most often just like a spreadsheet. Columns and rows, that's all there is to it! From here, we can utilize Pandas to perform operations on our data sets at lightning speeds.
Pandas is also compatible with many of the other data analysis libraries, like Scikit-Learn for machine learning, Matplotlib for Graphing, NumPy, since it uses NumPy, and more. It's incredibly powerful and valuable to know. If you're someone who finds themselves using Excel, or general spreadsheets, for various computational tasks, where they might take a minute, or an hour, to run, Pandas is going to change your life. I've even seen versions of Machine learning like K-Means clustering being done on Excel. That's really cool, but my Python is going to do that for you way faster, which will also allow you to be a bit more stringent on parameters, have larger datasets and just plain get more done.
Another bit of good news? You can easily load in, and output out in the xls or xlsx format quickly, so, even if your boss wants to view things the old way, they can. Pandas is also compatible with text files, csv, hdf files, xml, html, and more with its incredibly powerful IO.
If you're just now joining us with Python, you should be able to follow along without already having mastered Python, and this could even be your intro to Python in general. Most importantly, if you have questions, ask them! If you seek out answers for each of the areas of confusion, and do this for everything, eventually you will have a full picture. Most of your questions will be Google-able as well. Don't be afraid to Google your questions, it wont laugh at you, I promise. I still Google a lot of my goals to see if someone has some example code doing what I want to do, so don't feel like a noob just because you do it.
If I have not sold you yet on Pandas, the elevator pitch is: Lightning fast data analysis on spreadsheet-like data, with an extremely robust input/output mechanism for handling multiple data types and even converting to and from data types.
Assuming you've got Python installed. Next, go to your terminal or cmd.exe, and type:pip install pandas. Did you get a "pip is not a recognized command" or something similar? No problem, this means pip is not on your PATH. Pip is a program, but your machine doesn't just simply know where it is unless it is on your PATH. You can look up how to add something to your path if you like, but you can always just explicitly give the path to the program you want to execute. On Windows, for example, Python's pip is located in C:/Python34/Scripts/pip. Python34 means Python 3.4. If you have Python 3.6, then you would use Python36, and so on.
Thus, if regular pip install pandas didn't work, then you can do C:/Python34/Scripts/pip install pandas
On that note, another major point of contention for people is the editor they choose. The editor really does not matter in the grand scheme of things. You should try multiple editors, and go with the one that suits you best. Whatever you feel comfortable with, and you are productive with. That's what matters most in the end. Some employers are also going to force you to use editor X, Y, or Z in the end as well, so you probably shouldn't become dependent on editor features. With that, I prefer the simple IDLE, so that's what I will code in. Again though, you can code in Wing, emacs, Nano, Vim, PyCharm, IPython, whatever you want. To open IDLE, just go to start, search for IDLE, and choose that. From there, File > New, and boom you have a text editor with highlighting and a few other little things. We'll cover some of these minor things as we go.
Now, with whatever editor you are using, open it up, and let's write some quick code to check out a dataframe.
Generally, a DataFrame is closest to the Dictionary Python data structure. If you are not familiar with Dictionaries, there's a tutorial for that. I'll annotate things like that in the video, as well as having links to them in the description and on the text-based versions of the tutorials on PythonProgramming.net
First, let's make some simple imports:
import pandas as pd
import datetime
import pandas_datareader.data as web
Here, we import pandas as pd. This is just a common standard used when importing the Pandas module. Next, we import datetime, which we'll use in a moment to tell Pandas some dates that we want to pull data between. Finally, we import pandas.io.data as web, because we're going to use this to pull data from the internet. Next up:
start = datetime.datetime(2010, 1, 1)
end = datetime.datetime.now()
Here, we create start and end variables that are datetime objects, pulling data from Jan 1st 2010 to today. Now, we can create a dataframe like so:
df = web.DataReader("XOM", "morningstar", start, end)
This pulls data for Exxon from the Morningstar API (which we've had to change since the video, since both Yahoo and Google have stopped their APIs), storing the data to our df variable. Naming your dataframe df is not required, but again, is pretty popular standard for working with Pandas. It just helps people immediately identify the working dataframe without needing to trace the code back.
So this gives us a dataframe, how do we see it? Well, can can just print it, like:
print(df)
So that's a lot of space. The middle of the dataset is ignored, but that's still a lot of output. Instead, most people will just do:
print(df.head())Output:
                   Close   High     Low   Open    Volume
Symbol Date
XOM    2010-01-01  68.19  68.86  68.110  68.84         0
       2010-01-04  69.15  69.26  68.190  68.72  27811317
       2010-01-05  69.42  69.45  68.800  69.19  30178588
       2010-01-06  70.02  70.60  69.340  69.45  35047453
       2010-01-07  69.80  70.06  69.415  69.90  27194133
Morningstar's api returns slightly more complex formatted results. We can clean this up to be just rows and columns like a spreadsheet might be with:
df.reset_index(inplace=True)
df.set_index("Date", inplace=True)
df = df.drop("Symbol", axis=1)

print(df.head())
            Close   High     Low   Open    Volume
Date
2010-01-01  68.19  68.86  68.110  68.84         0
2010-01-04  69.15  69.26  68.190  68.72  27811317
2010-01-05  69.42  69.45  68.800  69.19  30178588
2010-01-06  70.02  70.60  69.340  69.45  35047453
2010-01-07  69.80  70.06  69.415  69.90  27194133
This prints the first 5 rows of the dataframe, and is useful for debugging and just generally seeing what your dataframe looks like. As you perform analysis and such, this will be useful to see if what you intended actually happened or not. We'll dive more into this later on, however.
We could stop here with the intro, but one more thing: Data Visualization. Like I said earlier, Pandas works great with other modules, Matplotlib being one of them. Let's see! Open your terminal or cmd.exe, and do pip install matplotlib. You should already have got it I am prety sure with your pandas installation, but we want to make sure. Now, at the top of your script with the other imports, add:
import matplotlib.pyplot as plt
from matplotlib import style

style.use('fivethirtyeight')
Pyplot is the basic matplotlib graphing module. Style helps us quickly make our graphs look good, and style.use lets us choose a style. Interested in learning more about Matplotlib? Check out the in-depth Matplotlib tutorial series!
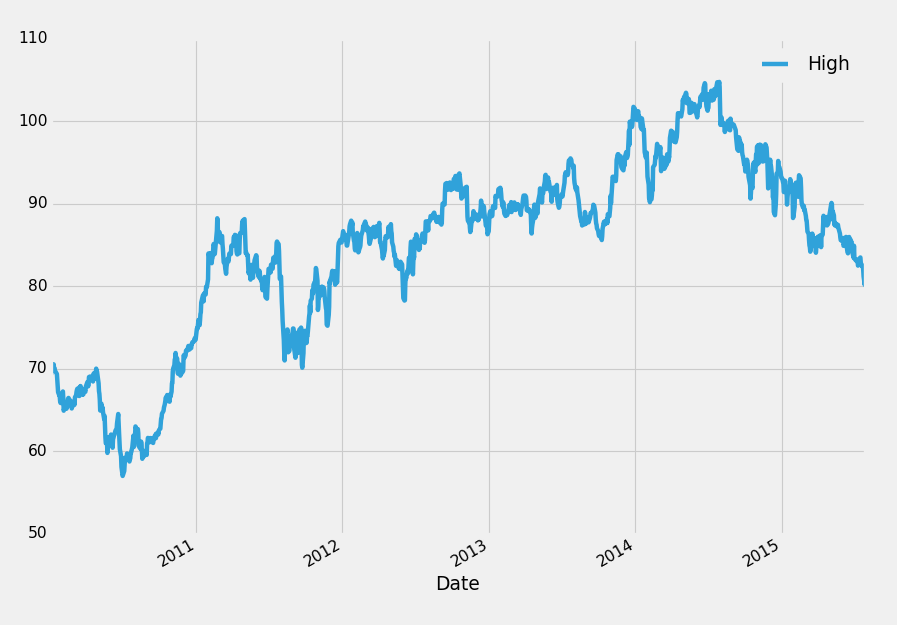
Next, below our print(df.head()), we can do something like:
df['High'].plot()
plt.legend()
plt.show()
Full code for that:
import datetime
import pandas_datareader.data as web
import matplotlib.pyplot as plt
from matplotlib import style

style.use('fivethirtyeight')

start = datetime.datetime(2010, 1, 1)
end = datetime.datetime.now()

df = web.DataReader("XOM", "morningstar", start, end)

df.reset_index(inplace=True)
df.set_index("Date", inplace=True)
df = df.drop("Symbol", axis=1)

print(df.head())

df['High'].plot()
plt.legend()
plt.show()
Pretty cool! There's a quick introduction to Pandas, but nowhere near what is available. In this series, we're going to be covering more of the basics of pandas, then move on to navigating and working with dataframes. From there, we'll touch a bit more on visualization, input and output with many data formats, basic and intermediate data analysis and operations, merging and combining dataframes, resampling, and much more with a lot of realistic examples.
If you're lost, confused, or need some clarity, don't hesitate to ask questions on the respective videos.
-
Data Analysis with Python and Pandas Tutorial Introduction
-
Pandas Basics - p.2 Data Analysis with Python and Pandas Tutorial
-
IO Basics - p.3 Data Analysis with Python and Pandas Tutorial
-
Building dataset - p.4 Data Analysis with Python and Pandas Tutorial
-
Concatenating and Appending dataframes - p.5 Data Analysis with Python and Pandas Tutorial
-
Joining and Merging Dataframes - p.6 Data Analysis with Python and Pandas Tutorial
-
Pickling - p.7 Data Analysis with Python and Pandas Tutorial
-
Percent Change and Correlation Tables - p.8 Data Analysis with Python and Pandas Tutorial
-
Resampling - p.9 Data Analysis with Python and Pandas Tutorial
-
Handling Missing Data - p.10 Data Analysis with Python and Pandas Tutorial
-
Rolling statistics - p.11 Data Analysis with Python and Pandas Tutorial
-
Applying Comparison Operators to DataFrame - p.12 Data Analysis with Python and Pandas Tutorial
-
Joining 30 year mortgage rate - p.13 Data Analysis with Python and Pandas Tutorial
-
Adding other economic indicators - p.14 Data Analysis with Python and Pandas Tutorial
-
Rolling Apply and Mapping Functions - p.15 Data Analysis with Python and Pandas Tutorial
-
Scikit Learn Incorporation - p.16 Data Analysis with Python and Pandas Tutorial
