A Basic TensorFlow.js Web Application Tutorial - TensorFlow.js Tutorial p.2
Welcome to the next part of the TensorFlow.js tutorial series. In this part, we're going to be building a simple TensorFlow.js webapp that we can interact with as a regular user, rather than by doing things in the console.
To begin, we'll start with the following skeleton:
<html>
  <head>
    <!-- Loading in TensorFlow.js version 0.11.2 -->
    <script src="https://cdn.jsdelivr.net/npm/@tensorflow/tfjs@0.11.2"> </script>
  </head>
  <body>
  </body>
</html>
For the purposes of this demo, we're also going to bring in a simple charting library, called chart.js, so now our head tags should be:
  <head>
    <!-- Loading in TensorFlow.js version 0.11.2 -->
    <script src="https://cdn.jsdelivr.net/npm/@tensorflow/tfjs@0.11.2"> </script>
    <script src="https://cdnjs.cloudflare.com/ajax/libs/Chart.js/2.7.2/Chart.bundle.min.js"> </script>
  </head>
Now, what shall our app due? My thought was to just make an application that takes in some coordinates for X and Y, and then, per user-input, generates a best-fit line approximation using TensorFlow.js, and drawing this line on our graph.
Between our body tags now, let's add the following:
  <body>
    x: <input type="text" id="x" />
    y: <input type="text" id="y" />
  </body>
I don't expect everyone watching to be javascript experts, but this would be fairly obvious what's going on here. It's just a couple of input forms, with ids that we can reference later to acquire the values in the fields.
I am not a JavaScript expert, I'm a bit below novice. To satisfy all of my JavaScript needs, I just Google what I am trying to do, until I find a solution that fits, sometimes with some slight tweaks.
Okay, so once we have some fields with some values, we want to collect these. A common way to do this in js is with a submit form. We could get much more fancy with this, but submit button will do!
<input type="button" id="append" value="submit">
Besides the data that we are going to be inputting, we wanted to also display the data. For this, we will be using the aforementioned chart.js. This will consist of slightly more complex looking javascript, which is mostly copy+pasted from their docs and slightly edited. Again though, it should be completely understand-able. If not, feel free to ask questions via comments on the video.
We will place our graph inside some div tags, like so:
    <div style="padding:50px">
        <canvas id="myChart" width="600" height="300"></canvas>
    </div>
With this, we're ready to take the data we've placed into the fields, and graph it. Let's just do that first, then we can add in the TensorFlow.js for the dynamic best-fit line.
The next script block will handle populating the data, graphing the chart, and later calculating the best-fit line:
    <script>
        var xs = [] // starts empty, to be populated with .push
        var ys = [] // starts empty, to be populated with .push
    </script>
We will pouplate the above vars with data from the inputs. From there, we're just going to automatically increment x by 1 in the field with:
document.getElementById('x').value = 1; // create a starting value for our x
Now we want to populate those values when the submit button is pressed. We can do this with .onclick:
document.getElementById("append").onclick = function(){}
Whatever we put inside those curly braces at the end will be run on the submit. So what do we need to put in here? For now, we need to populate our arrays and make our graph. To populate them:
        document.getElementById("append").onclick = function(){
            var x = document.getElementById("x").value; // grab the current value for x
            var y = document.getElementById("y").value; // grab the current value for y
            xs.push(x) // append that value to the xs
            ys.push(y) // append that value to the ys}
The .push appends the values to the end. Now that we've done this, we want to automatically increment x by 1:
document.getElementById('x').value = parseInt(x)+1; // add 1 to the x automatically
With our code, we can still modify X to be something else if we wanted, but that will over-complicate this simple example, so let's just...not do that. Next, we have our values, we just need to populate our chart! This is mostly chart.js code, so I am just going to copy and paste the rest in:
    <script>
        var xs = [] // starts empty, to be populated with .push
        var ys = [] // starts empty, to be populated with .push
        document.getElementById('x').value = 1; // create a starting value for our x

        // the append id is given to our submit button, this will be called
        document.getElementById("append").onclick = function(){
            var x = document.getElementById("x").value; // grab the current value for x
            var y = document.getElementById("y").value; // grab the current value for y
            xs.push(x) // append that value to the xs
            ys.push(y) // append that value to the ys
            document.getElementById('x').value = parseInt(x)+1; // add 1 to the x automatically
            var ctx = document.getElementById("myChart").getContext('2d'); // begin chart

            // Chart data and settings:
            var myChart = new Chart(ctx, {
                type: 'line',
                options: {scales:{yAxes: [{ticks: {beginAtZero: true}}]}},
                data: {
                    labels: xs,
                    datasets: [
                    {
                        label: 'Original Data',
                        data: ys,
                        borderWidth: 1,
                    }]
                },
            });
        }
    </script>
Full code up to this point:
<html>
  <head>
    <!-- Loading in TensorFlow.js version 0.11.2 -->
    <script src="https://cdn.jsdelivr.net/npm/@tensorflow/tfjs@0.11.2"> </script>
    <script src="https://cdnjs.cloudflare.com/ajax/libs/Chart.js/2.7.2/Chart.bundle.min.js"> </script>
  </head>
  <body>
    x: <input type="text" id="x" />
    y: <input type="text" id="y" />

    <input type="button" id="append" value="submit">

    <div style="padding:50px">
        <canvas id="myChart" width="600" height="300"></canvas>
    </div>

    <script>
        var xs = [] // starts empty, to be populated with .push
        var ys = [] // starts empty, to be populated with .push
        document.getElementById('x').value = 1; // create a starting value for our x

        // the append id is given to our submit button, this will be called
        document.getElementById("append").onclick = function(){
            var x = document.getElementById("x").value; // grab the current value for x
            var y = document.getElementById("y").value; // grab the current value for y
            xs.push(x) // append that value to the xs
            ys.push(y) // append that value to the ys
            document.getElementById('x').value = parseInt(x)+1; // add 1 to the x automatically
            var ctx = document.getElementById("myChart").getContext('2d'); // begin chart

            // Chart data and settings:
            var myChart = new Chart(ctx, {
                type: 'line',
                options: {scales:{yAxes: [{ticks: {beginAtZero: true}}]}},
                data: {
                    labels: xs,
                    datasets: [
                    {
                        label: 'Original Data',
                        data: ys,
                        borderWidth: 1,
                    }]
                },
            });
        }
    </script>
  </body>
</html>
Running this should give you something like:
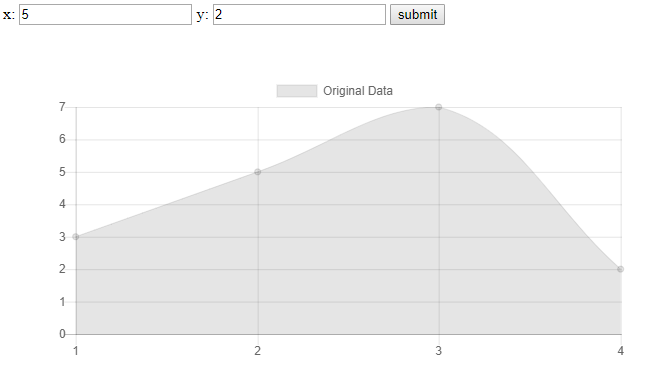
At this point, we've just got a basic webapp that graphs user input. Now, let's add some TensorFlow.js magic!
Our goal for now is to just create a best-fit line with this data. We'll create a 2-layer model:
        //Create the model
        const model = tf.sequential();
        model.add(tf.layers.leakyReLU({units: 128, inputShape: [1]})); // layer 1
        model.add(tf.layers.leakyReLU({units: 128, inputShape: [128]})); // layer 2
        model.add(tf.layers.dense({units: 1, inputShape: [128]})); // output layer
        model.compile({loss: 'meanSquaredError', optimizer: 'adam'}); // compile with params
We will define the above outside of our click function, no reason to define that every single time.
Now, within the click function, we need to train the model based on the data the user has input, and then we want to make our prediction.
We cannot really do this inline. TensorFlow works with JavaScript promises, which are just asynchronous operations that return either a successful result or an error. We want this to be asynchronous so that our application doesn't just hang. When we train a model, it could take a few seconds, or more. We don't want to just freeze during this time, but, at the same time, we can't graph our updated best-fit line either. We need to wait. To do this, we will use .then, which can be done like so:
model.fit(tf.tensor(xs), tf.tensor(ys), {epochs:150}).then(() => {}
After fitment, we want to calculate our bestfit line:
            model.fit(tf.tensor(xs), tf.tensor(ys), {epochs:150}).then(() => {
                bestfit = model.predict(tf.tensor(xs, [xs.length, 1])).dataSync();
                }
Once we have done this, we're ready to create our graph based on input data and the best-fit line, making our full fitment and graph function:
        document.getElementById("append").onclick = function(){
            var x = document.getElementById("x").value; // grab the current value for x
            var y = document.getElementById("y").value; // grab the current value for y
            xs.push(x) // append that value to the xs
            ys.push(y) // append that value to the ys
            document.getElementById('x').value = parseInt(x)+1; // add 1 to the x automatically

            // Train the model...then:
            model.fit(tf.tensor(xs), tf.tensor(ys), {epochs:150}).then(() => {
                bestfit = model.predict(tf.tensor(xs, [xs.length, 1])).dataSync(); // create best-fit line from xs data
                var ctx = document.getElementById("myChart").getContext('2d'); // begin chart
                // Chart data and settings:
                var myChart = new Chart(ctx, {
                    type: 'line',
                    options: {scales:{yAxes: [{ticks: {beginAtZero: true}}]}},
                    data: {
                        labels: xs,
                        datasets: [
                        {
                            label: 'Original Data',
                            data: ys,
                            borderWidth: 1,
                        },{
                            label: 'Best Fit line',
                            data: bestfit,
                            borderWidth: 1,
                            borderColor: '#FF0000',
                            backgroundColor: 'rgba(1,1,1,0)'
                        },]
                    },
                });
              });
        }
The full application is:
<html>
  <head>
    <!-- Loading in TensorFlow.js version 0.11.2 -->
    <script src="https://cdn.jsdelivr.net/npm/@tensorflow/tfjs@0.11.2"> </script>
    <script src="https://cdnjs.cloudflare.com/ajax/libs/Chart.js/2.7.2/Chart.bundle.min.js"> </script>
  </head>
  <body>
    x: <input type="text" id="x" />
    y: <input type="text" id="y" />

    <input type="button" id="append" value="submit">

    <div style="padding:50px">
        <canvas id="myChart" width="600" height="300"></canvas>
    </div>

    <script>
        var xs = [] // starts empty, to be populated with .push
        var ys = [] // starts empty, to be populated with .push
        var bestfit = [] // to be populated by tf.js

        //Create the model
        const model = tf.sequential();
        model.add(tf.layers.leakyReLU({units: 128, inputShape: [1]})); // layer 1
        model.add(tf.layers.leakyReLU({units: 128, inputShape: [128]})); // layer 2
        model.add(tf.layers.dense({units: 1, inputShape: [128]})); // output layer
        model.compile({loss: 'meanSquaredError', optimizer: 'adam'}); // compile with params


        document.getElementById('x').value = 1; // create a starting value for our x

        // the append id is given to our submit button, this will be called
        document.getElementById("append").onclick = function(){
            var x = document.getElementById("x").value; // grab the current value for x
            var y = document.getElementById("y").value; // grab the current value for y
            xs.push(x) // append that value to the xs
            ys.push(y) // append that value to the ys
            document.getElementById('x').value = parseInt(x)+1; // add 1 to the x automatically

            // Train the model...then:
            model.fit(tf.tensor(xs), tf.tensor(ys), {epochs:150}).then(() => {
                bestfit = model.predict(tf.tensor(xs, [xs.length, 1])).dataSync(); // create best-fit line from xs data
                var ctx = document.getElementById("myChart").getContext('2d'); // begin chart
                // Chart data and settings:
                var myChart = new Chart(ctx, {
                    type: 'line',
                    options: {scales:{yAxes: [{ticks: {beginAtZero: true}}]}},
                    data: {
                        labels: xs,
                        datasets: [
                        {
                            label: 'Original Data',
                            data: ys,
                            borderWidth: 1,
                        },{
                            label: 'Best Fit line',
                            data: bestfit,
                            borderWidth: 1,
                            borderColor: '#FF0000',
                            backgroundColor: 'rgba(1,1,1,0)'
                        },]
                    },
                });
              });
        }
    </script>
  </body>
</html>
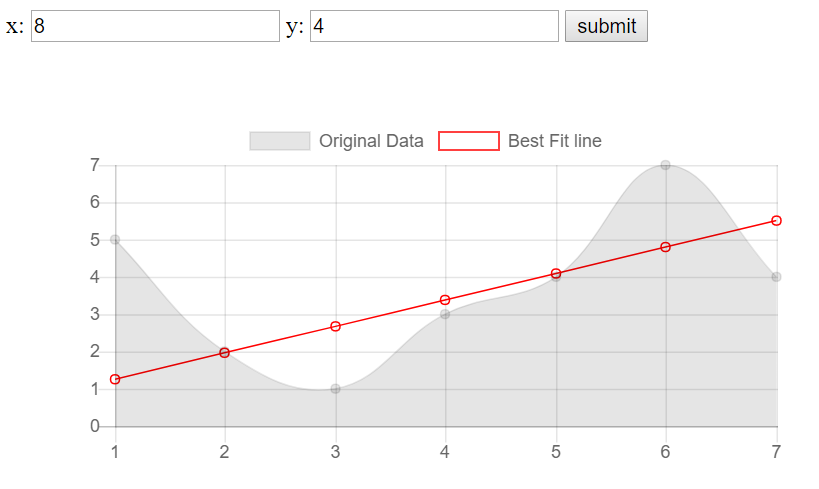
The result:
Okay, this is all a nice, raw, use of TensorFlow.js to get your feet wet, but now we want to escalate things just a bit. There's still a whole lot more that we can do. In the next tutorial, we're going to accelerate our JavaScript code quite a bit with a game of pong, where we allow a neural network to control one of the paddles.
I didn't originally notice it, but someone mentioned during the livestream that the best-fit line was linear, even if the input data was, despite having multiple layers. The reason for this is we are using a linear activation function. What we can do is make a few simple changes to our model. Currently our model is:
const model = tf.sequential();
model.add(tf.layers.leakyReLU({units: 128, inputShape: [1]})); // layer 1
model.add(tf.layers.leakyReLU({units: 128, inputShape: [128]})); // layer 2
model.add(tf.layers.dense({units: 1, inputShape: [128]})); // output layer
model.compile({loss: 'meanSquaredError', optimizer: 'adam'}); // compile with params
What we want to do now is change our ReLU layers to activate with some sort of sigmoid function. Let's change to dense layers and add our activation to the middle layer:
const model = tf.sequential();
model.add(tf.layers.dense({units: 128, inputShape: [1]})); // layer 1
model.add(tf.layers.dense({units: 128, inputShape: [128], activation: "sigmoid"})); // layer 2
model.add(tf.layers.dense({units: 1, inputShape: [128]})); // output layer
model.compile({loss: 'meanSquaredError', optimizer: 'adam'}); // compile with params
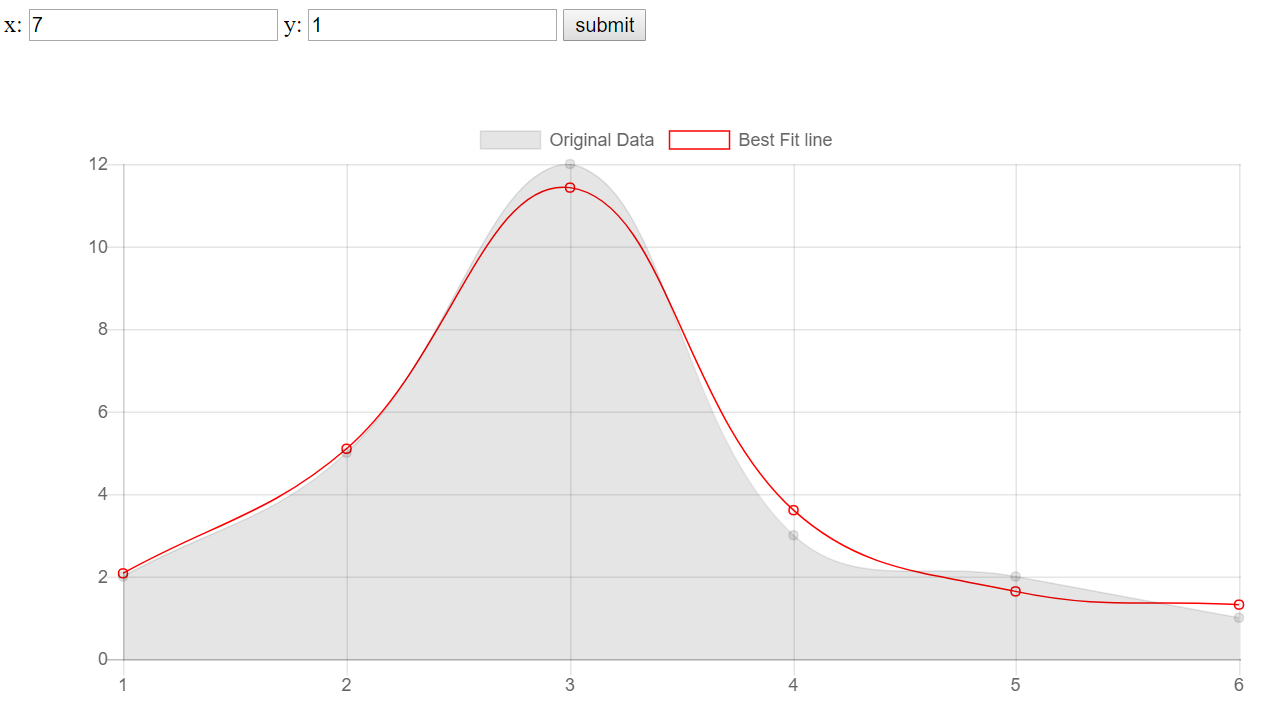
This is enough to give us something more like: