Linear SVC Machine learning SVM example with Python
The most applicable machine learning algorithm for our problem is Linear SVC. Before hopping into Linear SVC with our data, we're going to show a very simple example that should help solidify your understanding of working with Linear SVC.
The objective of a Linear SVC (Support Vector Classifier) is to fit to the data you provide, returning a "best fit" hyperplane that divides, or categorizes, your data. From there, after getting the hyperplane, you can then feed some features to your classifier to see what the "predicted" class is. This makes this specific algorithm rather suitable for our uses, though you can use this for many situations. Let's get started.
First, we're going to need some basic dependencies:
import numpy as np
import matplotlib.pyplot as plt
from matplotlib import style
style.use("ggplot")
from sklearn import svm
Matplotlib here is not truly necessary for Linear SVC. The reason why we're using it here is for the eventual data visualization. Typically, you wont be able to visualize as many dimensions as you will have features, but, it's worth visualizing at least once to understand how linear svc works.
Other than the visualization packages we're using, you will just need to import svm from sklearn and numpy for array conversion.
Next, let's consider that we have two features to consider. These features will be visualized as axis on our graph. So something like:
x = [1, 5, 1.5, 8, 1, 9]
y = [2, 8, 1.8, 8, 0.6, 11]
Then we can graph this data using:
plt.scatter(x,y)
plt.show()
The result is:
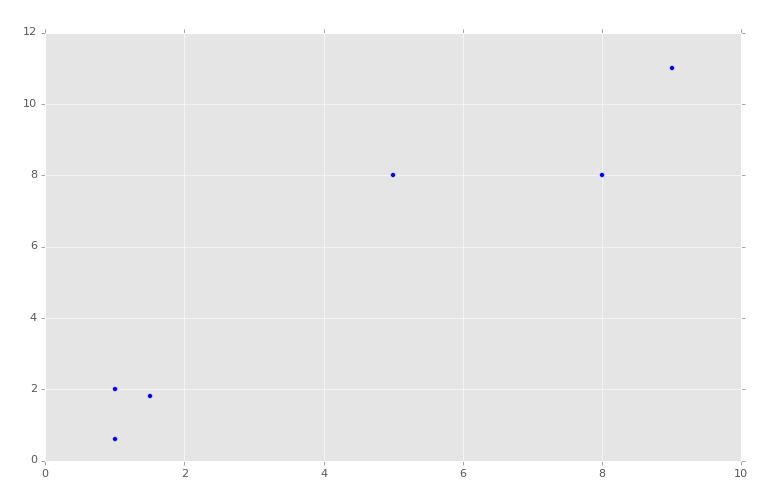
Now, of course, we can see with our own eyes how these groups should be divided, though exactly where we might draw the dividing line might be debated:
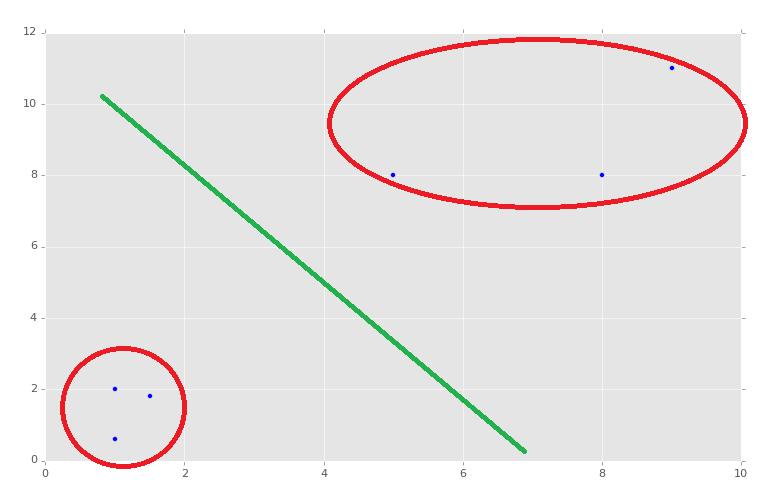
So this is with two features, and we see we have a 2D graph. If we had three features, we could have a 3D graph. The 3D graph would be a little more challenging for us to visually group and divide, but still do-able. The problem occurs when we have four features, or four-thousand features. Now you can start to understand the power of machine learning, seeing and analyzing a number of dimensions imperceptible to us.
With that in mind, we're going to go ahead and continue with our two-featured example. Now, in order to feed data into our machine learning algorithm, we first need to compile an array of the features, rather than having them as x and y coordinate values.
Generally, you will see the feature list being stored in a capital X variable. Let's translate our above x and y coordinates into an array that is compiled of the x and y coordinates, where x is a feature and y is a feature.
X = np.array([[1,2],
             [5,8],
             [1.5,1.8],
             [8,8],
             [1,0.6],
             [9,11]])
Now that we have this array, we need to label it for training purposes. There are forms of machine learning called "unsupervised learning," where data labeling isn't used, as is the case with clustering, though this example is a form of supervised learning.
For our labels, sometimes referred to as "targets," we're going to use 0 or 1.
y = [0,1,0,1,0,1]
Just by looking at our data set, we can see we have coordinate pairs that are "low" numbers and coordinate pairs that are "higher" numbers. We've then assigned 0 to the lower coordinate pairs and 1 to the higher feature pairs.
These are the labels. In the case of our project, we will wind up having a list of numerical features that are various statistics about stock companies, and then the "label" will be either a 0 or a 1, where 0 is under-perform the market and a 1 is out-perform the market.
Moving along, we are now going to define our classifier:
clf = svm.SVC(kernel='linear', C = 1.0)
We're going to be using the SVC (support vector classifier) SVM (support vector machine). Our kernel is going to be linear, and C is equal to 1.0. What is C you ask? Don't worry about it for now, but, if you must know, C is a valuation of "how badly" you want to properly classify, or fit, everything. The machine learning field is relatively new, and experimental. There exist many debates about the value of C, as well as how to calculate the value for C. We're going to just stick with 1.0 for now, which is a nice default parameter.
Next, we call:
clf.fit(X,y)
Note: this is an older tutorial, and Scikit-Learn has since deprecated this method. By version 0.19, this code will cause an error because it needs to be a numpy array, and re-shaped. To see an example of converting to a NumPy array and reshaping, check out this K Nearest Neighbors tutorial, near the end. You do not need to follow along with that series to mimic what is done there with the reshaping, and continue along with this series.
From here, the learning is done. It should be nearly-instant, since we have such a small data set.
Next, we can predict and test. Let's print a prediction:
print(clf.predict([0.58,0.76]))
We're hoping this predicts a 0, since this is a "lower" coordinate pair.
Sure enough, the prediction is a classification of 0. Next, what if we do:
print(clf.predict([10.58,10.76]))
And again, we have a theoretically correct answer of 1 as the classification. This was a blind prediction, though it was really a test as well, since we knew what the hopeful target was. Congratulations, you have 100% accuracy!
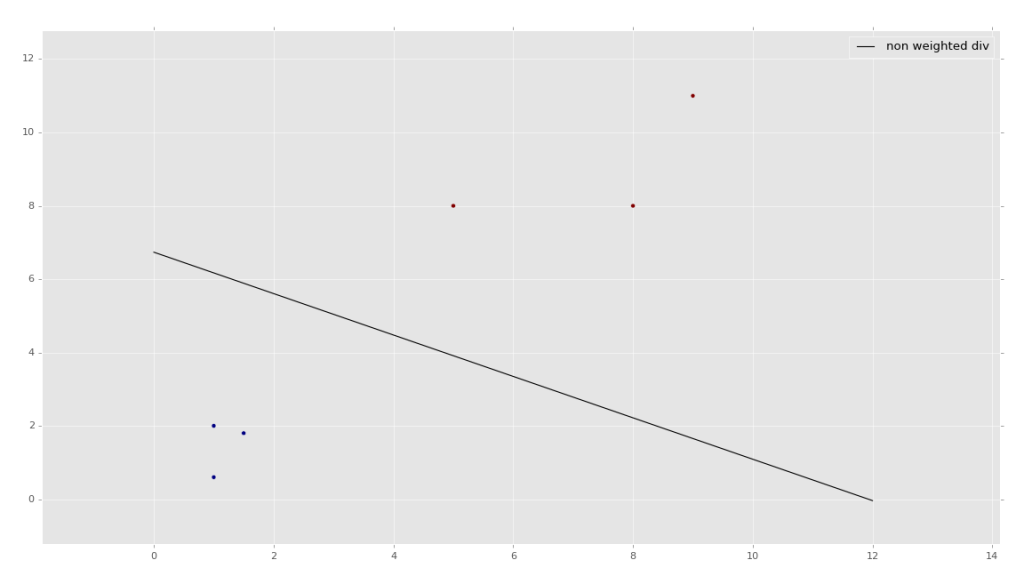
Now, to visualize your data:
w = clf.coef_[0]
print(w)

a = -w[0] / w[1]

xx = np.linspace(0,12)
yy = a * xx - clf.intercept_[0] / w[1]

h0 = plt.plot(xx, yy, 'k-', label="non weighted div")

plt.scatter(X[:, 0], X[:, 1], c = y)
plt.legend()
plt.show()
The result:
If you'd like a bit more explanation on how the graphing code works, watch the second-half of the embedded video. Visualizing the data is somewhat useful to see what the program is doing in the background, but is not really necessary to understand how to visualize it specifically at this point. You will likely find that the problems you are trying to solve simply cannot be visualized due to having too many features and thus too many dimensions to graph.
There exists 1 challenge(s) for this tutorial. for access to these, video downloads, and no ads.
There exists 2 quiz/question(s) for this tutorial. for access to these, video downloads, and no ads.
-
Intro to Machine Learning with Scikit Learn and Python
-
Simple Support Vector Machine (SVM) example with character recognition
-
Our Method and where we will be getting our Data
-
Parsing data
-
More Parsing
-
Structuring data with Pandas
-
Getting more data and meshing data sets
-
Labeling of data part 1
-
Labeling data part 2
-
Finally finishing up the labeling
-
Linear SVC Machine learning SVM example with Python
-
Getting more features from our data
-
Linear SVC machine learning and testing our data
-
Scaling, Normalizing, and machine learning with many features
-
Shuffling our data to solve a learning issue
-
Using Quandl for more data
-
Improving our Analysis with a more accurate measure of performance in relation to fundamentals
-
Learning and Testing our Machine learning algorithm
-
More testing, this time including N/A data
-
Back-testing the strategy
-
Pulling current data from Yahoo
-
Building our New Data-set
-
Searching for investment suggestions
-
Raising investment requirement standards
-
Testing raised standards
-
Streamlining the changing of standards
