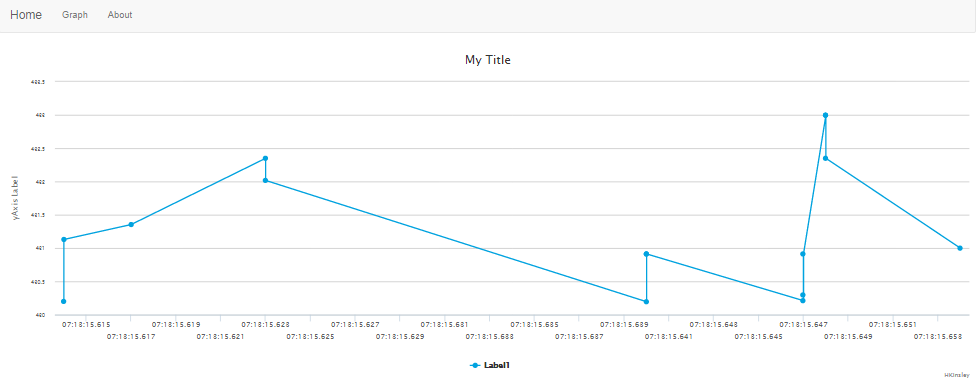
Using javascript plugins, with a Highcharts example
At this point, you have the basics to create a simple static website. Often, however, you may find that you want to incorporate some sort of javascript plugin. This could be a wide range of things, like adding chat boxes, adding WebGL, or, like we're going to do, adding fancy graphs.
For this tutorial, we're going to use Highcharts. I've used these for a few years now, and I have been very happy with them. They are still in active development as well. Just like Bootstrap, after you begin using these, you'll probably start to notice just how many people use this graphing application!
For example, I will post two things. First is the example I found on the topic:
https://gist.github.com/vgoklani/5347161.
For this specific tutorial, here are the files you will need:
/static/graph.js:
$(document).ready(function() {
	$(chart_id).highcharts({
		chart: chart,
		title: title,
		xAxis: xAxis,
		yAxis: yAxis,
		series: series
	});
});
Next, in your index.html, you just need to add the following lines (full page posted below)
<div id={{ chartID|safe }} class="chart" style="height: 100px; width: 500px"></div>
<script>
	var chart_id = {{ chartID|safe }}
	var series = {{ series|safe }}
	var title = {{ title|safe }}
	var xAxis = {{ xAxis|safe }}
	var yAxis = {{ yAxis|safe }}
	var chart = {{ chart|safe }}
</script>
	<script src="http://ajax.googleapis.com/ajax/libs/jquery/1.8.2/jquery.min.js"></script>
	<script src="http://code.highcharts.com/highcharts.js"></script>
	<script src="../static/graph.js"></script>
index.html:
<html>
<link rel="stylesheet" media="screen" href = "{{ url_for('static', filename='bootstrap.min.css') }}">
<meta name="viewport" content = "width=device-width, initial-scale=1.0">
<head>
</head>

<body class = "body">
<nav class="navbar navbar-default" role="navigation">
  <div class="container-fluid">
    <!-- Brand and toggle get grouped for better mobile display -->
    <div class="navbar-header">
      <button type="button" class="navbar-toggle" data-toggle="collapse" data-target="#bs-example-navbar-collapse-1">
        <span class="sr-only">Toggle navigation</span>
        <span class="icon-bar"></span>
        <span class="icon-bar"></span>
        <span class="icon-bar"></span>
      </button>
      <a class="navbar-brand" href="#">Brand</a>
    </div>

    <!-- Collect the nav links, forms, and other content for toggling -->
    <div class="collapse navbar-collapse" id="bs-example-navbar-collapse-1">
      <ul class="nav navbar-nav">
        <li class="active"><a href="#">Link</a></li>
        <li><a href="#">Link</a></li>
        <li class="dropdown">
          <a href="#" class="dropdown-toggle" data-toggle="dropdown">Dropdown <span class="caret"></span></a>
          <ul class="dropdown-menu" role="menu">
            <li><a href="#">Action</a></li>
            <li><a href="#">Another action</a></li>
            <li><a href="#">Something else here</a></li>
            <li class="divider"></li>
            <li><a href="#">Separated link</a></li>
            <li class="divider"></li>
            <li><a href="#">One more separated link</a></li>
          </ul>
        </li>
      </ul>
      <form class="navbar-form navbar-left" role="search">
        <div class="form-group">
          <input type="text" class="form-control" placeholder="Search">
        </div>
        <button type="submit" class="btn btn-default">Submit</button>
      </form>
      <ul class="nav navbar-nav navbar-right">
        <li><a href="#">Link</a></li>
        <li class="dropdown">
          <a href="#" class="dropdown-toggle" data-toggle="dropdown">Dropdown <span class="caret"></span></a>
          <ul class="dropdown-menu" role="menu">
            <li><a href="#">Action</a></li>
            <li><a href="#">Another action</a></li>
            <li><a href="#">Something else here</a></li>
            <li class="divider"></li>
            <li><a href="#">Separated link</a></li>
          </ul>
        </li>
      </ul>
    </div><!-- /.navbar-collapse -->
  </div><!-- /.container-fluid -->
</nav>


	<body>
		<h3>{{ title }}</h3>
		{% for p in paragraph %}
		<p>{{ p }}</p>
		{% endfor %}

		{% if pageType == 'about' %}
		<p>Contact box thing is here</p>
		{% else %}
		<p>not about page</p>
		{% endif %}


		<div id={{ chartID|safe }} class="chart" style="height: 100px; width: 500px"></div>
		<script>
			var chart_id = {{ chartID|safe }}
			var series = {{ series|safe }}
			var title = {{ title|safe }}
			var xAxis = {{ xAxis|safe }}
			var yAxis = {{ yAxis|safe }}
			var chart = {{ chart|safe }}
		</script>
			<script src="http://ajax.googleapis.com/ajax/libs/jquery/1.8.2/jquery.min.js"></script>
			<script src="http://code.highcharts.com/highcharts.js"></script>
			<script src="../static/graph.js"></script>

	</body>


</body>

<script type = "text/javascript" src = "/static/bootstrap.min.js"></script>


</html>
Then we need to add the following to our __init__.py:
@app.route('/graph')
def graph(chartID = 'chart_ID', chart_type = 'line', chart_height = 500):
	chart = {"renderTo": chartID, "type": chart_type, "height": chart_height,}
	series = [{"name": 'Label1', "data": [1,2,3]}, {"name": 'Label2', "data": [4, 5, 6]}]
	title = {"text": 'My Title'}
	xAxis = {"categories": ['xAxis Data1', 'xAxis Data2', 'xAxis Data3']}
	yAxis = {"title": {"text": 'yAxis Label'}}
	return render_template('index.html', chartID=chartID, chart=chart, series=series, title=title, xAxis=xAxis, yAxis=yAxis)
So the full __init__.py file:
from flask import Flask, render_template

app = Flask(__name__)

@app.route('/')
def homepage():

    title = "Epic Tutorials"
    paragraph = ["wow I am learning so much great stuff!wow I am learning so much great stuff!wow I am learning so much great stuff!wow I am learning so much great stuff!","wow I am learning so much great stuff!wow I am learning so much great stuff!wow I am learning so much great stuff!wow I am learning so much great stuff!wow I am learning so much great stuff!wow I am learning so much great stuff!wow I am learning so much great stuff!wow I am learning so much great stuff!wow I am learning so much great stuff!"]

    try:
        return render_template("index.html", title = title, paragraph=paragraph)
    except Exception, e:
        return str(e)

@app.route('/about')
def aboutpage():

    title = "About this site"
    paragraph = ["blah blah blah memememememmeme blah blah memememe"]

    pageType = 'about'

    return render_template("index.html", title=title, paragraph=paragraph, pageType=pageType)


@app.route('/about/contact')
def contactPage():

    title = "About this site"
    paragraph = ["blah blah blah memememememmeme blah blah memememe"]

    pageType = 'about'

    return render_template("index.html", title=title, paragraph=paragraph, pageType=pageType)


@app.route('/graph')
def graph(chartID = 'chart_ID', chart_type = 'line', chart_height = 500):
	chart = {"renderTo": chartID, "type": chart_type, "height": chart_height,}
	series = [{"name": 'Label1', "data": [1,2,3]}, {"name": 'Label2', "data": [4, 5, 6]}]
	title = {"text": 'My Title'}
	xAxis = {"categories": ['xAxis Data1', 'xAxis Data2', 'xAxis Data3']}
	yAxis = {"title": {"text": 'yAxis Label'}}
	return render_template('index.html', chartID=chartID, chart=chart, series=series, title=title, xAxis=xAxis, yAxis=yAxis)

if __name__ == "__main__":
	app.run(debug = True, host='0.0.0.0', port=8080, passthrough_errors=True)
Cool, so what's fundamentally happening here? First, we have the init file, where we're defining and passing through a bunch of variables, like we've covered in the past. These vars are being passed to index.html, so let's look at that.
So, within our index.html, we can see exactly where these variables are being passed. They are actually being passed as definitions to more variables! This time, the variables are in a quick javascript block, where we define some of the necessary elements to our graph. So, finally, what happens next? We can see the included js files below that block, we're using jquery, then the highcharts script, then finally the graph.js. Let's look there again next.
We can then see that graph.js is very simple, and it just passes the variables that originated in the init file, then made their way to index.html, then are finally residing in the graph.js file, which is what actually generates our lovely graph.
All of these things come together and voila, we have a pretty js plugin graph, which is being fed data and information by Python. Yay!
